BusViz
Monitor and improve the performance of bus fleets.
LIVE DEMO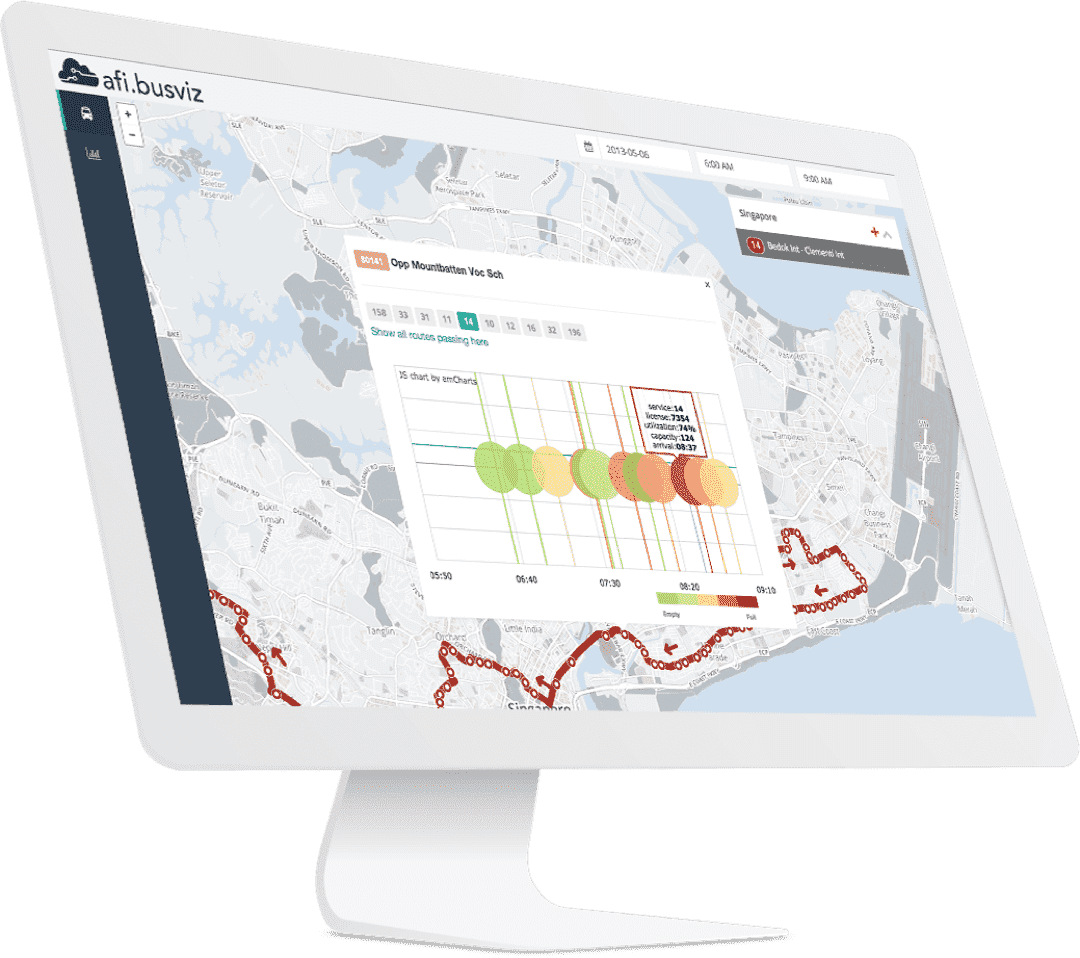
Use real data to instantly identify bus bunching and visualize network capacity, congestion and delays
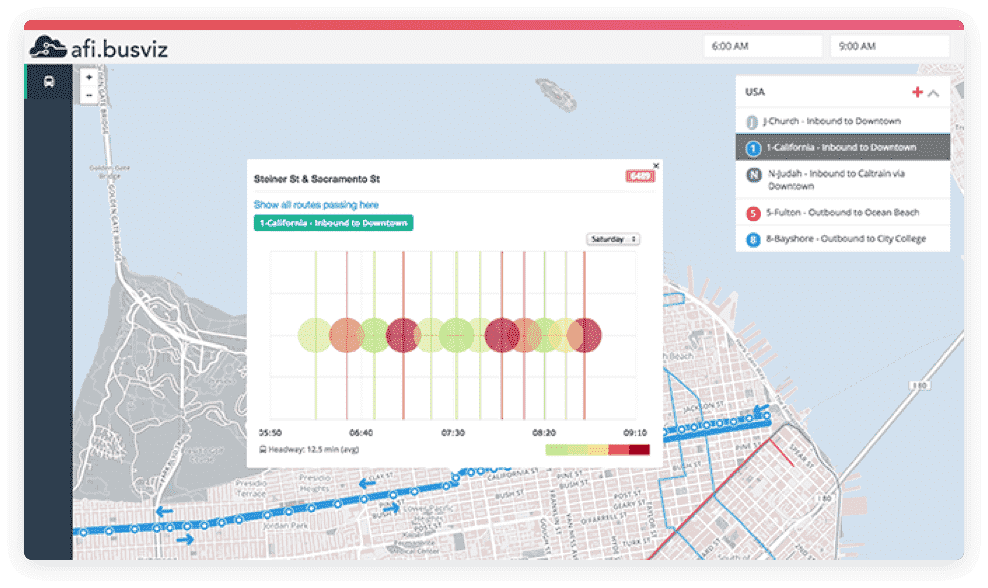
The bus stop view displays bus loads together with their arrival headways and standard deviations. This allows you to determine crowdedness, bus reliability and punctiality at any bus stop in your network.
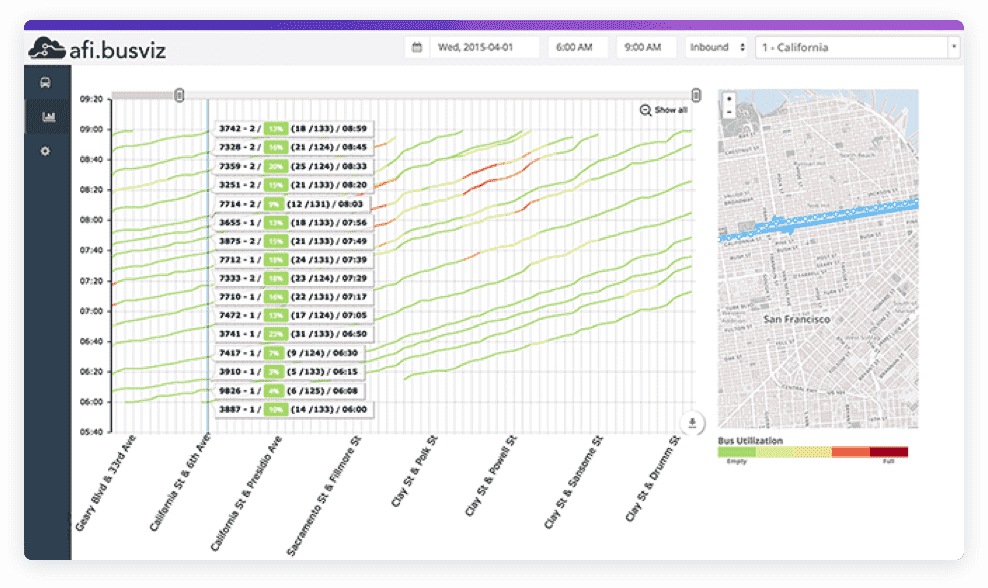
Bus trajectories are colored according to the number of passengers on board. Mousing over a bus stop brings up statistics (e.g. arrival time, loading etc.) for each bus arrival.
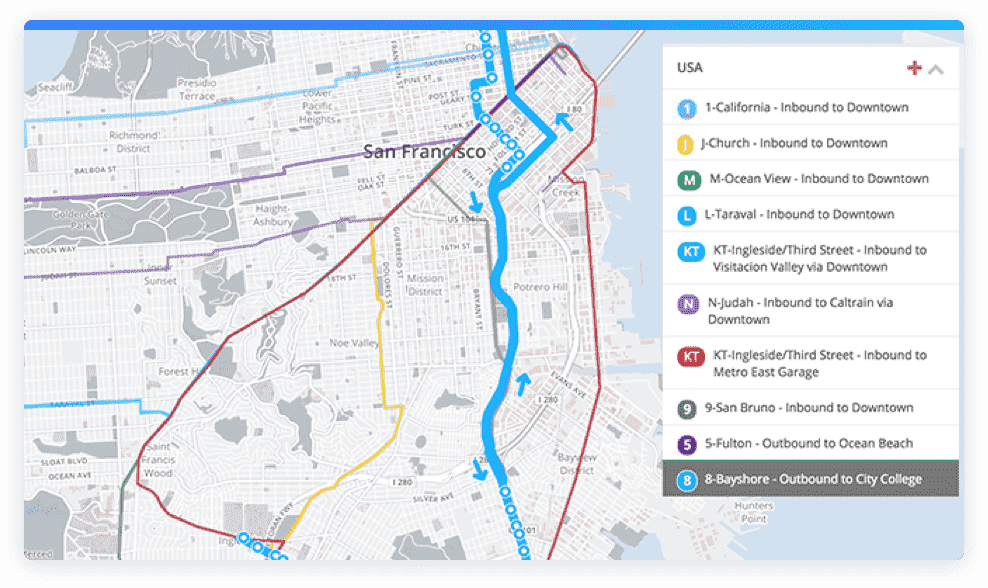
Use the map view to show all bus routes passing through a bus stop. This quickly provides an overall picture of service accessibility in a particular neighborhood.
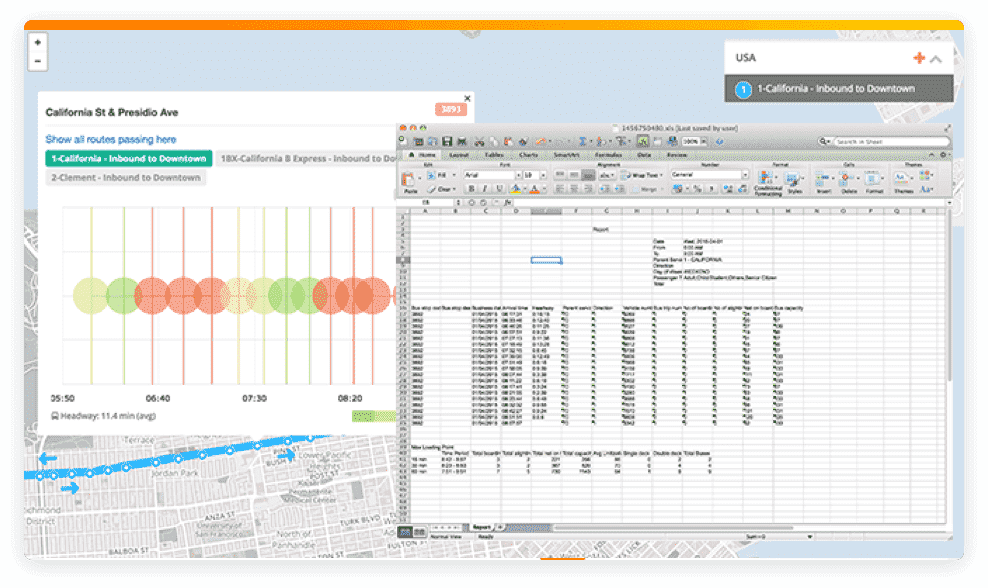
Dig deep into your data without having to write SQL statements or a single line of code. Customize your reporting, produce data driven presentations and build your own interactive analysis tools.

595 Burrard Street
Vancouver,
BC V7X1L4
Canada

12 Marina Boulevard
Marina Bay Financial Center Tower 3,
Level 17-01
Singapore 018982

