Apply styles for Google Maps using JSON style arrays
Learn how to style Google Maps with embedded JSON style declarations. Customize colors, roads, and labels directly in code.

The simplest way to apply styles for Google Maps is with an embedded JSON style declaration. You pass an array of MapTypeStyle objects to the styles property in MapOptions, and your custom styling appears on the next render. No Cloud Console setup and no Map ID required. Best of all, you don't have to start from scratch. Websites like Snazzy Maps host thousands of user contributed styles you can drop in as-is or use as a jumping off point for your own design.
Part 1: Style a Google Map any way you want
Part 2: Apply styles for Google Maps using JSON style arrays (this article)
Part 3: Cloud based map styling for Google Maps
Part 4: Google Maps data driven styling for boundaries
Part 5: Create a heatmap in Google Maps with data driven styling
Part 6: Upload and style datasets using the Maps Datasets API
Part 7: Add data to Google Maps with data driven styling
How do embedded JSON styles work?
Embedded JSON styles is the legacy way to customize how a Google Map looks by passing it a list of styling rules as a JSON array. Each rule targets some part of the map and tells it how to look e.g.
var stylesArray = [
  {
    featureType: '',
    elementType: '',
    stylers: [
      {color: ''},
      {visibility: ''},
      // Add any stylers you need.
    ]
  },
  {
    featureType: '',
    // Add the stylers you need.
  }
]
Each item in the array is an object with up to three fields:
featureType: what kind of map feature this rule applies to (water, roads, parks, buildings, labels, etc).
elementType: which part of that feature (the geometry/shape itself, or the labels/text on it) should be customized.
stylers: what to do with it (change color, hide it, adjust saturation, etc).
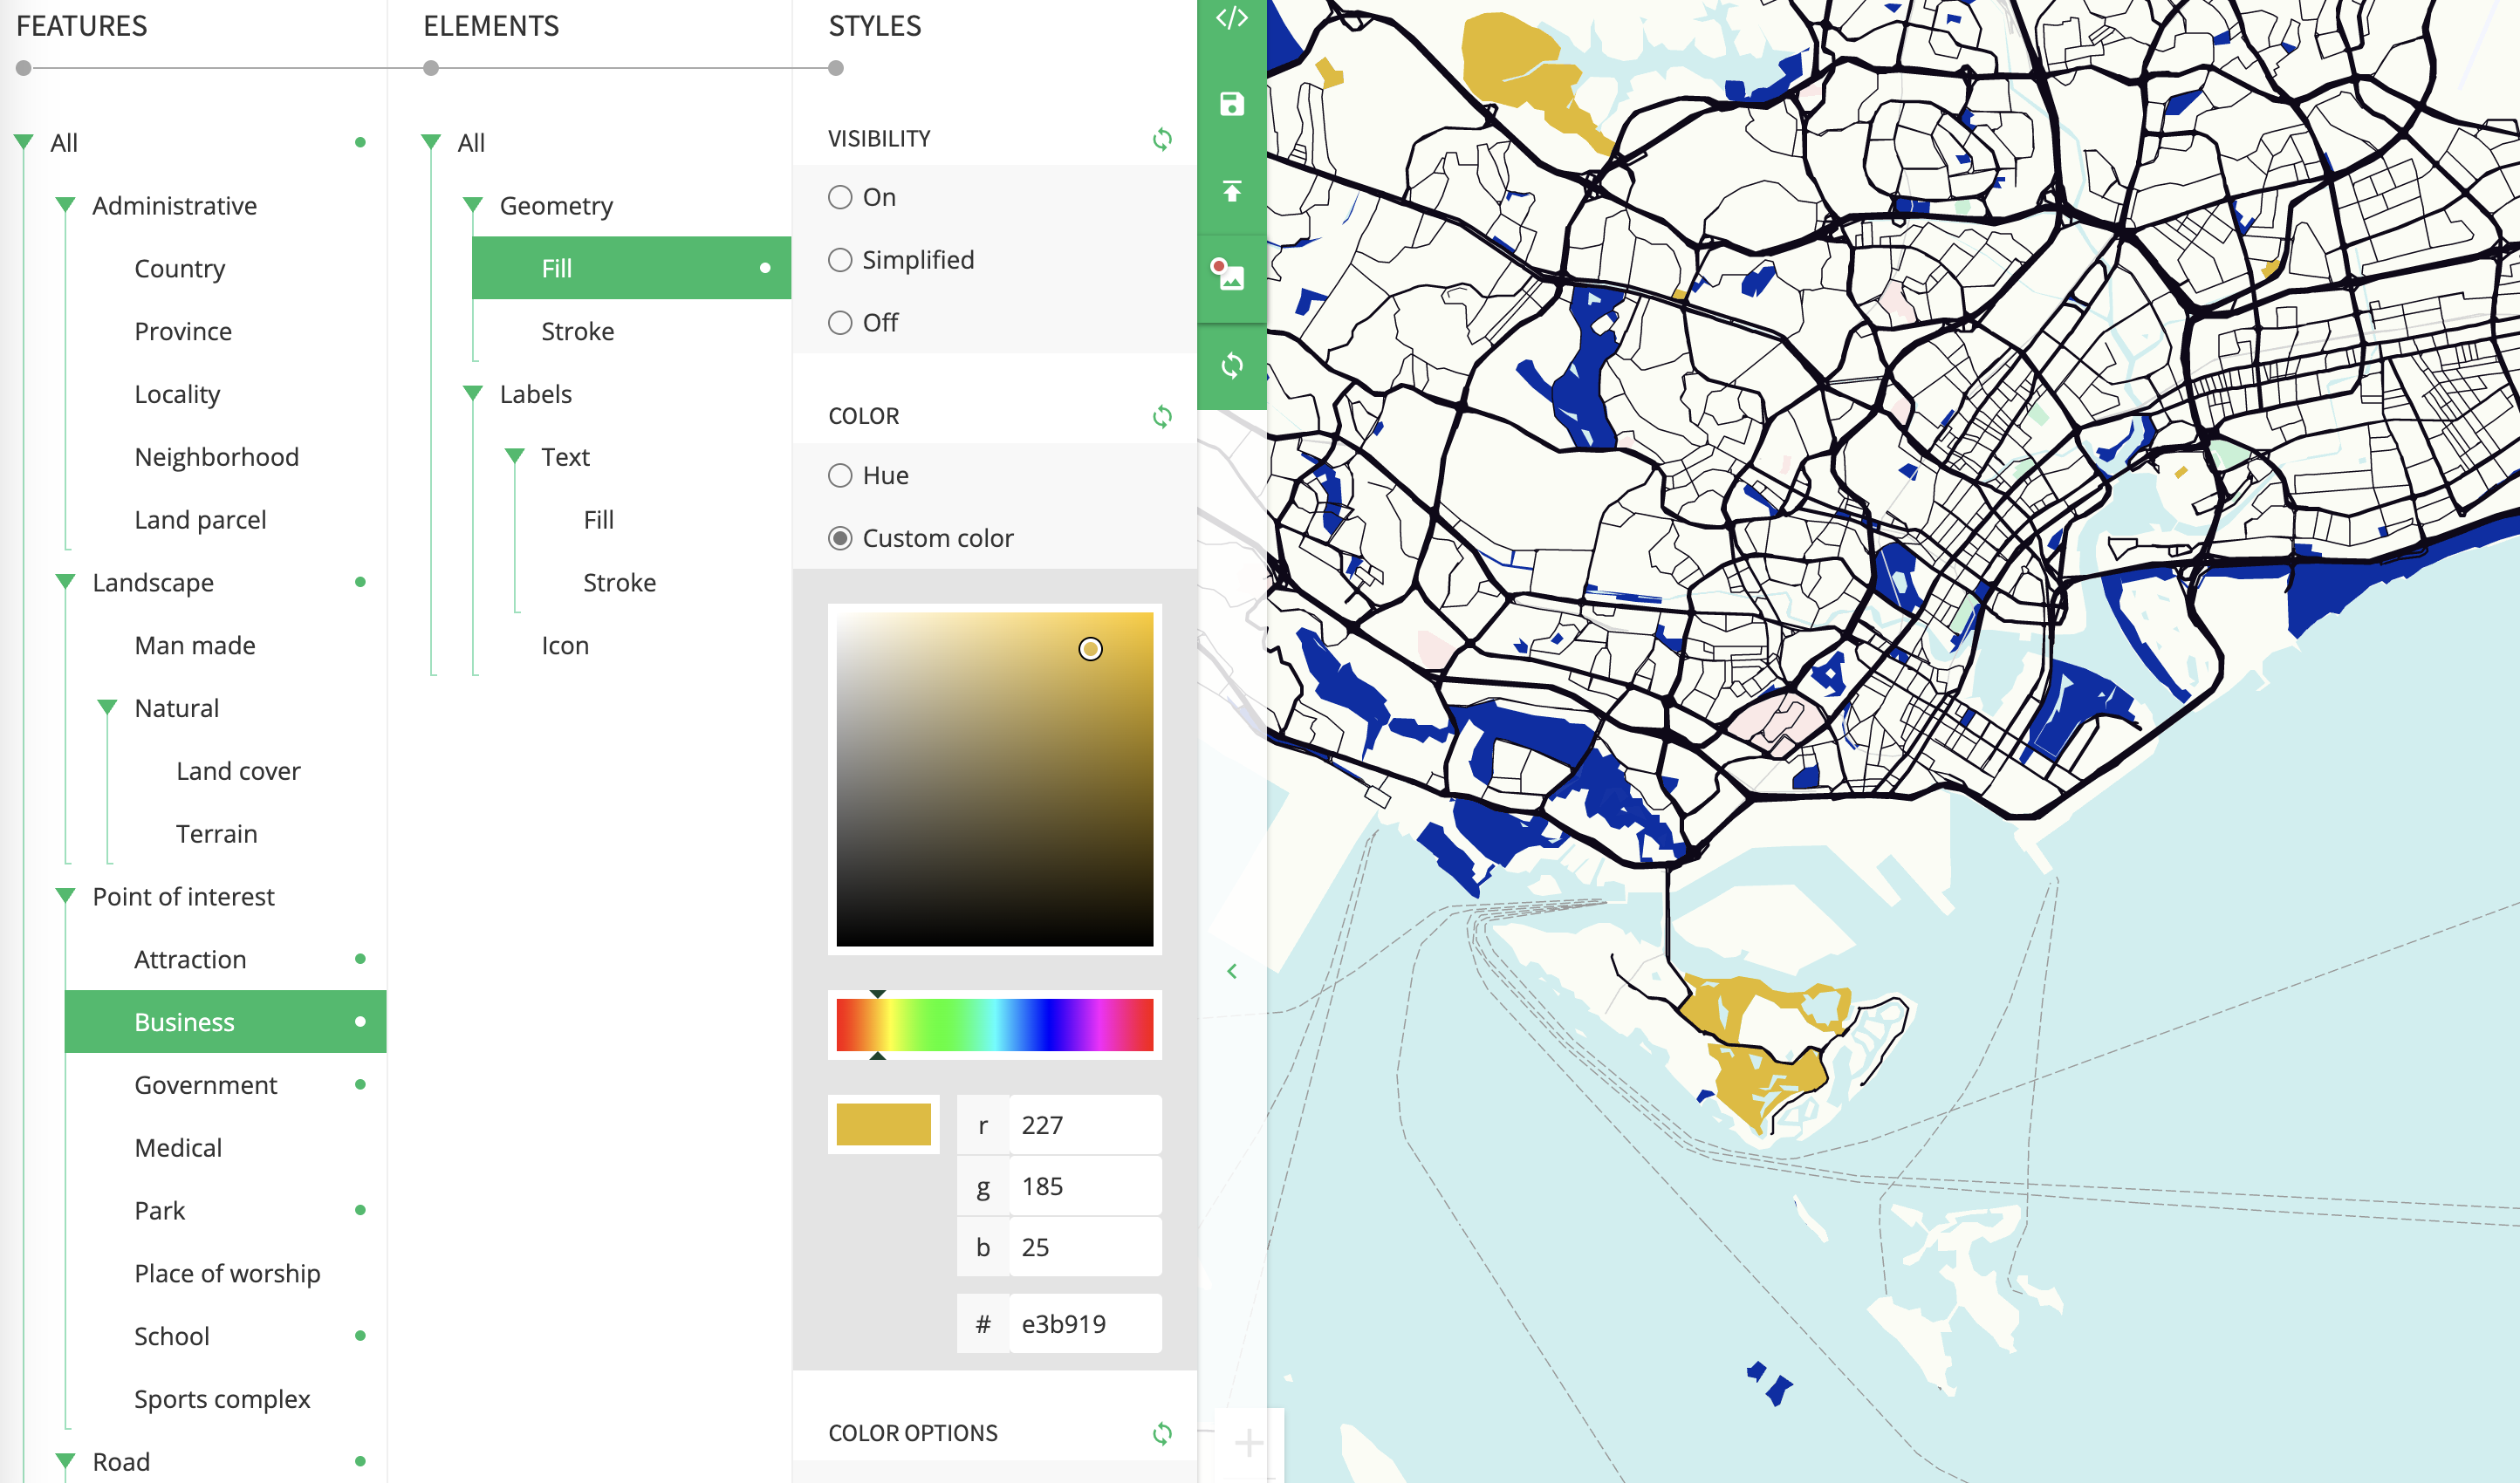
For example, in the JSON example below, all points of interest (poi) tagged business are colored gold (#E3B919).
{
  "featureType": "poi.business",
  "elementType": "geometry.fill",
  "stylers": [
    {
      "color": "#E3B919"
    }
  ]
}
The most common stylers attributes to modify are:
visibility (on, off, or simplified) indicates whether and how the element appears on the map. A simplified visibility removes some style features from the affected features; roads, for example, are simplified into thinner lines without outlines, while parks lose their label text but retain the label icon.
color (an RGB hex string of format #RRGGBB) sets the color of the feature.
weight (an integer value, greater than or equal to zero) sets the weight of the feature, in pixels. Setting the weight to a high value may result in clipping near tile borders.
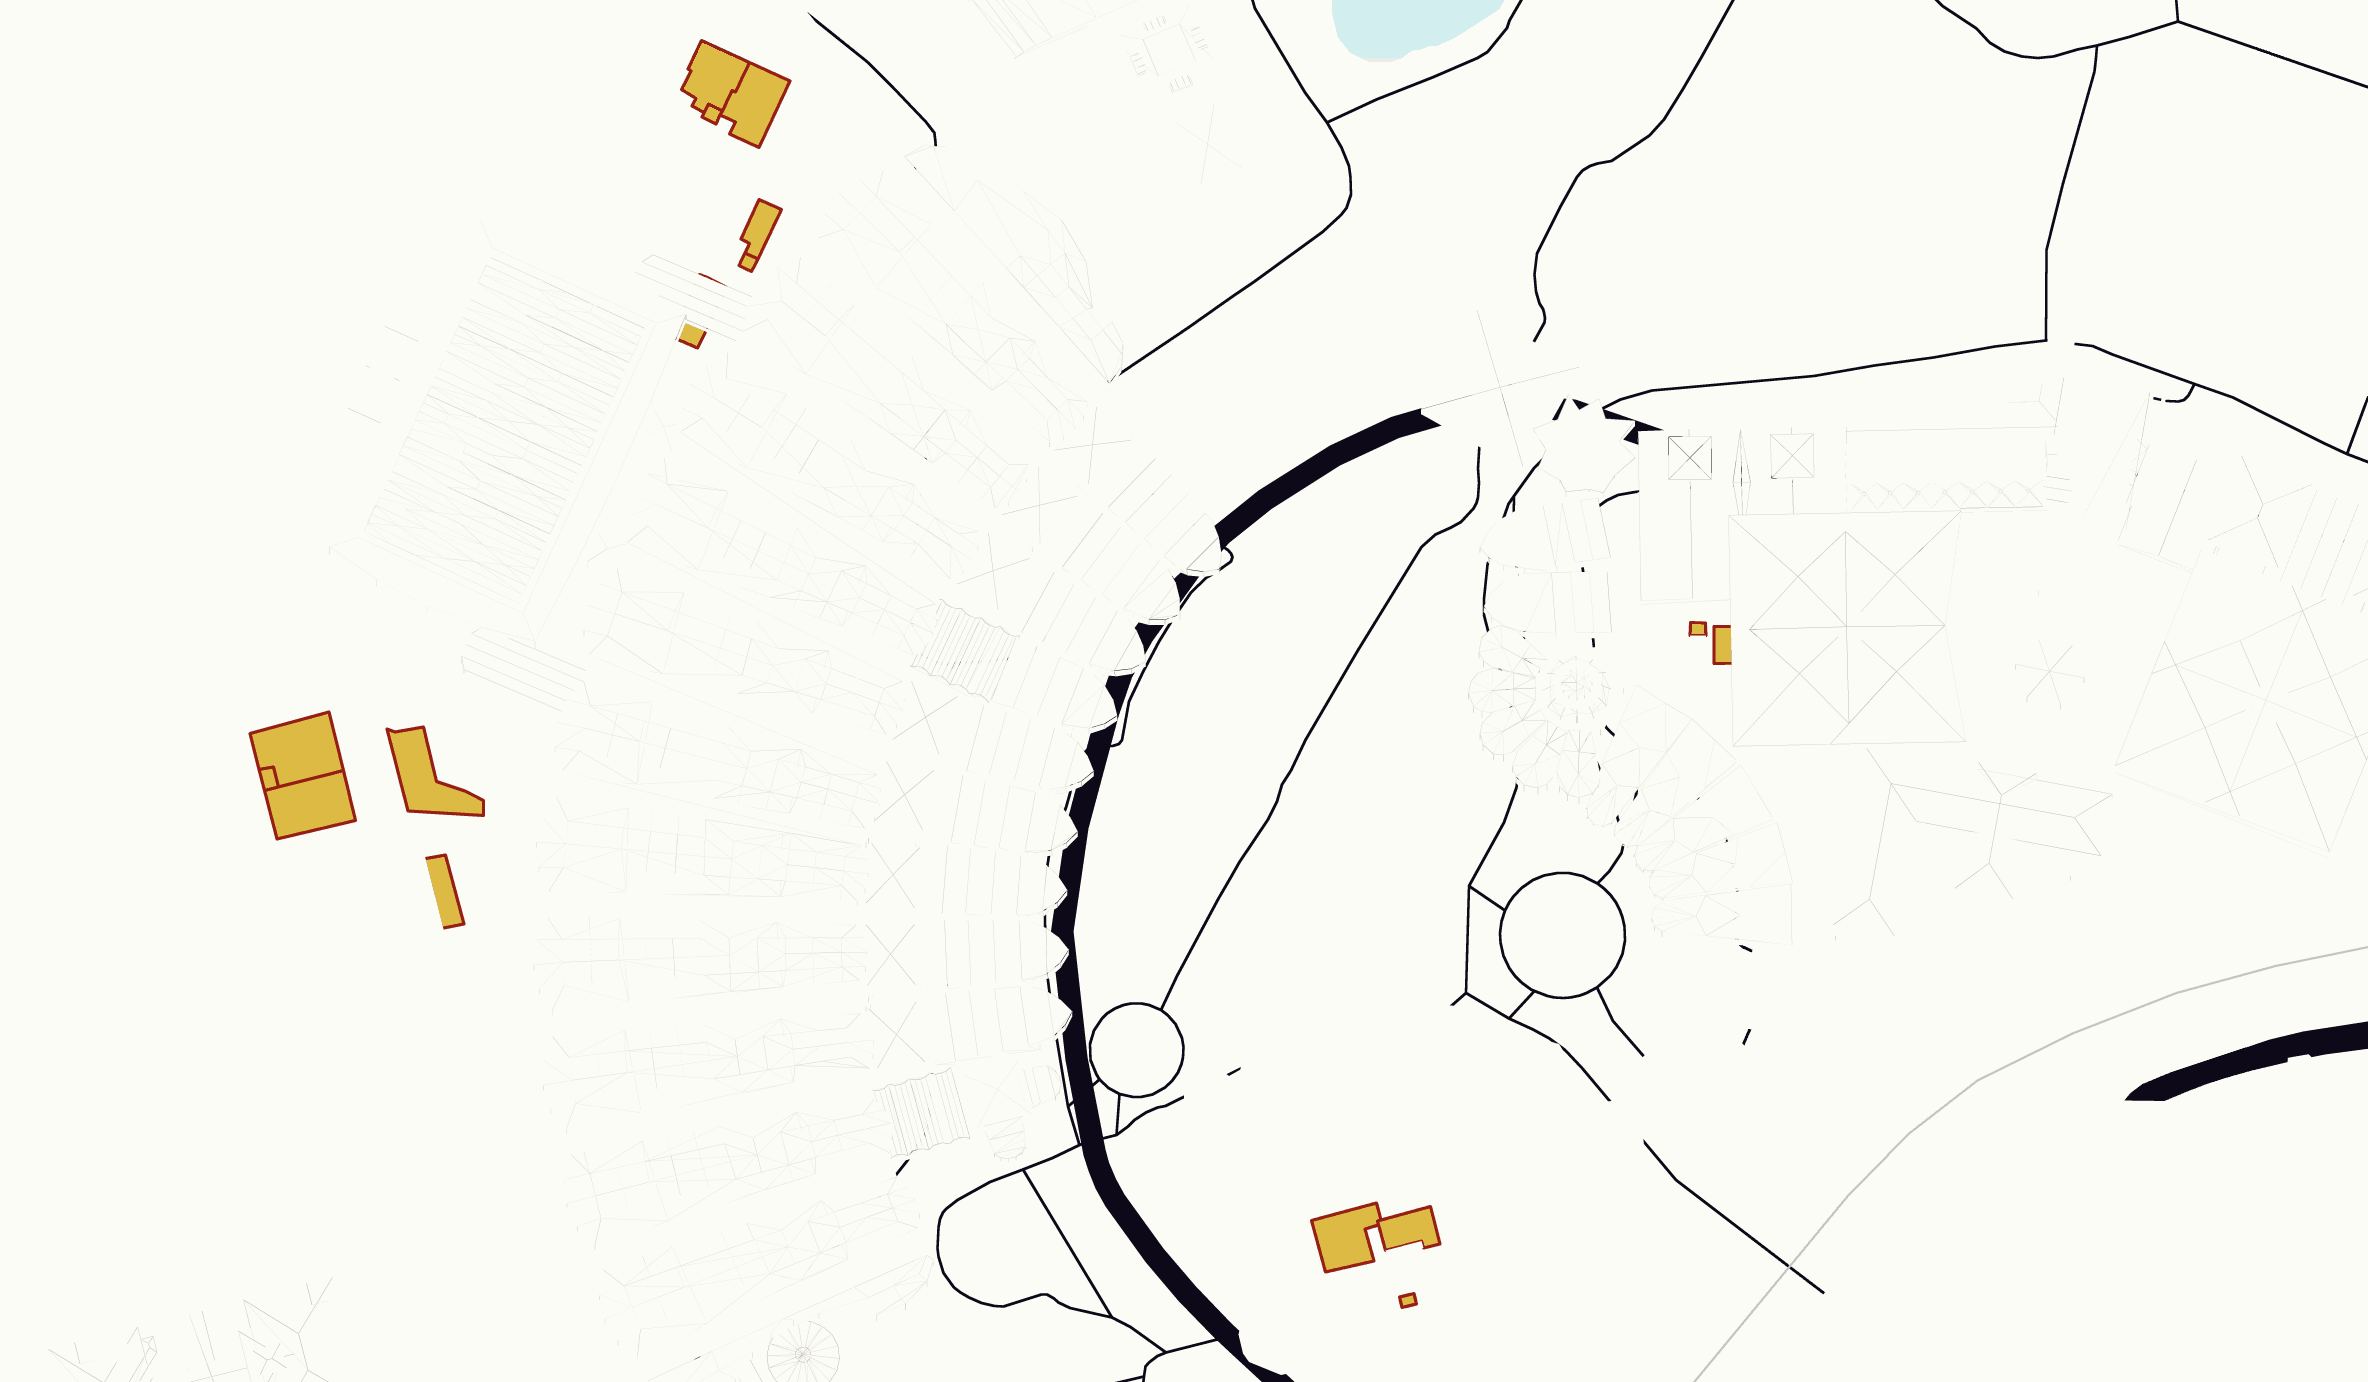
A full list of formatting options that you can apply to map features and elements is available here. If you want to add a brown border to the business POIs all you'd need to do is add styling the geometry.stroke element of poi.business.
{
"featureType": "poi.business",
"elementType": "geometry.stroke",
"stylers": [
{
"color": "#a60303"
},
{
"visibility": "on"
},
{
"weight": "1.50"
}
]
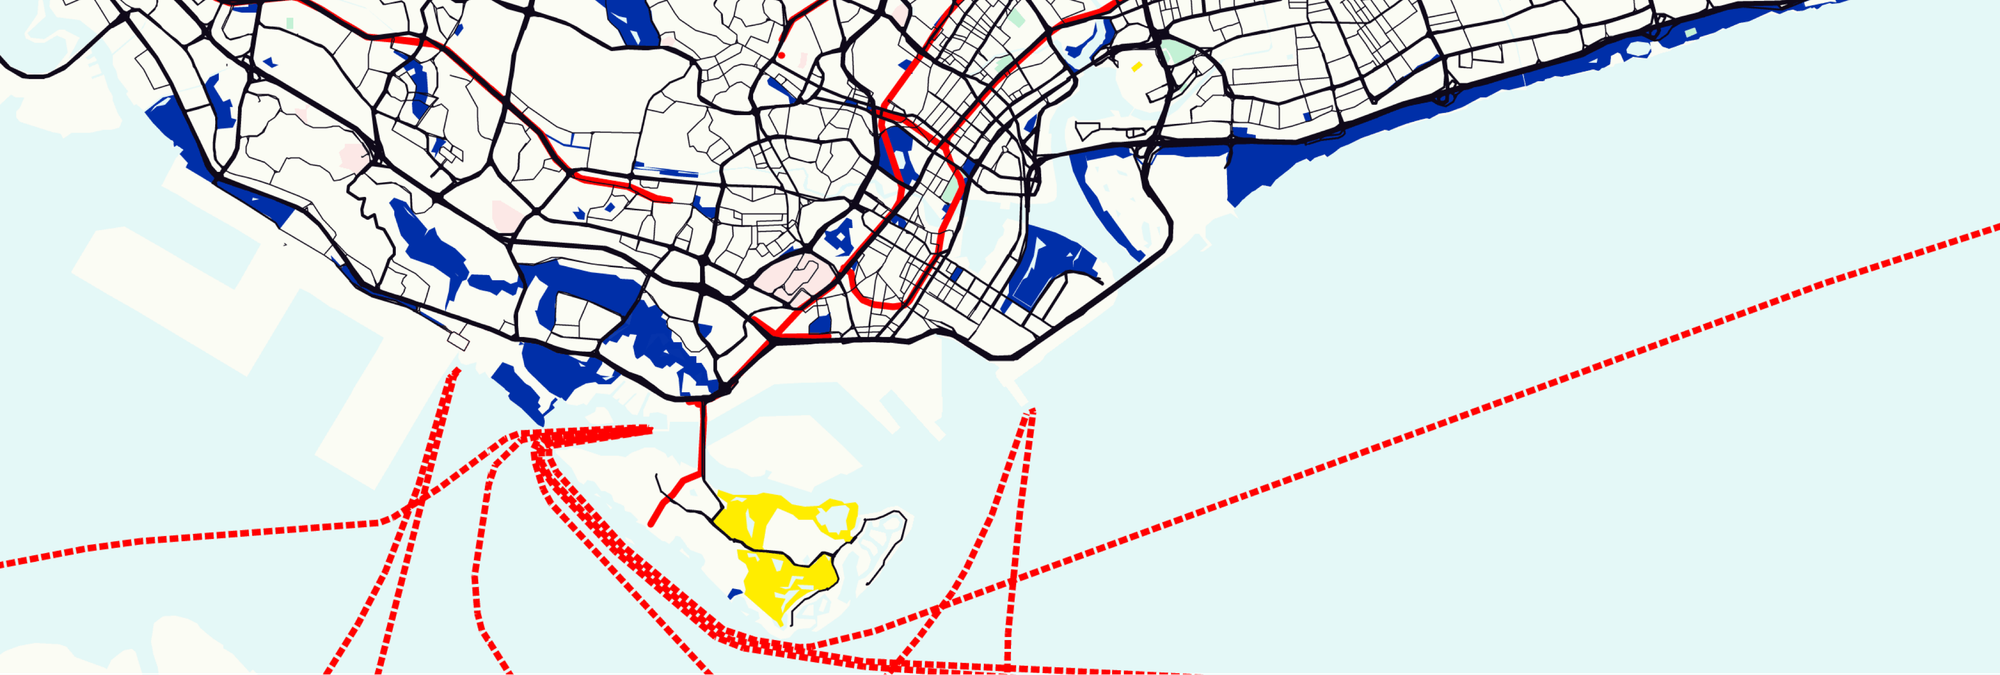
}When you refresh your map, you'll see the business areas bordered with a brown outline.
Apply styles for Google Maps using Snazzy Maps
Imagine for a moment that you paid a visit to the Guggenheim Museum in New York City and fell in love with the geometric abstract art of Dutch painter Piet Mondrain. You want to pay a tribute his famous Composition with Red, Blue and Yellow by replicating its iconic palette in your map - bold primary colors on a clean white field, anchored by crisp black lines. What's the best way to do so?
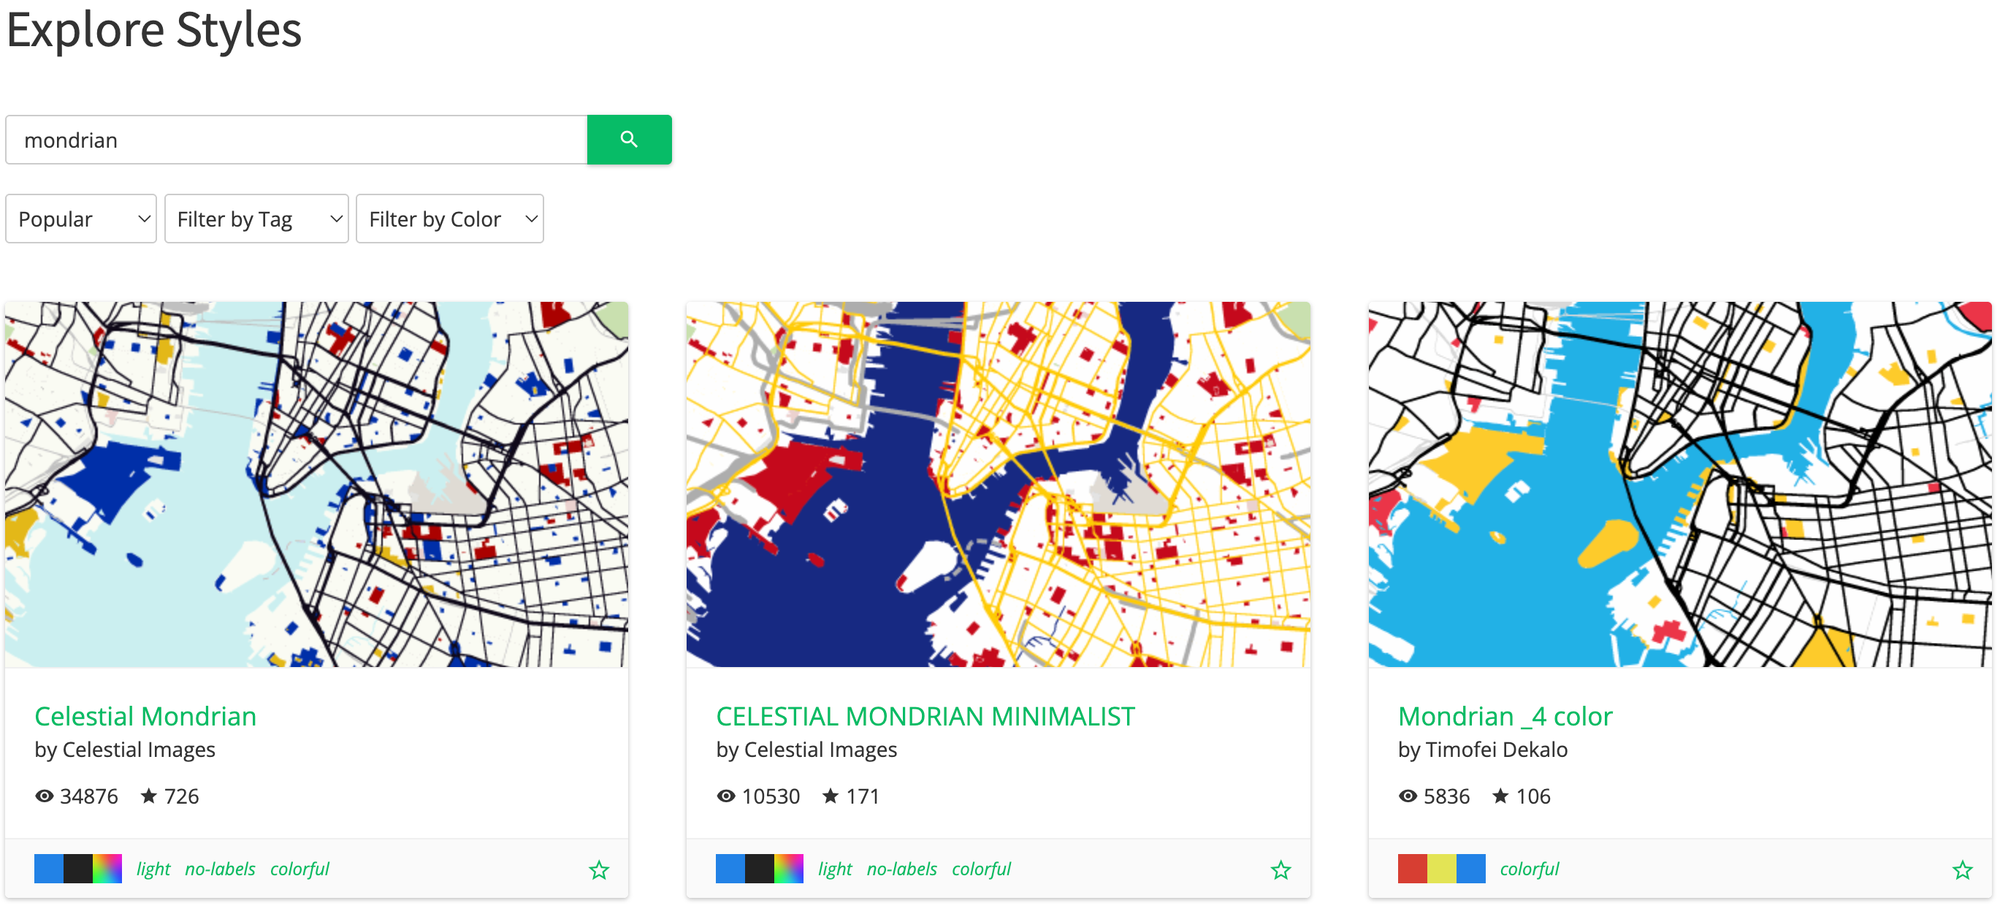
You could build the styles array from scratch, but a better option is to head to SnazzyMaps.com, search for "mondrian", and pick a style you like (I liked Celestial Mondrian best). Click into it and edit the feature properties as you see fit. The map on the right updates automatically as you change them. For this exercise, let's give the map's transit lines a bold red. Red (specifically #DD0E0E) together with yellow and blue was one of Mondrian's "sanctioned" colors in his later works.
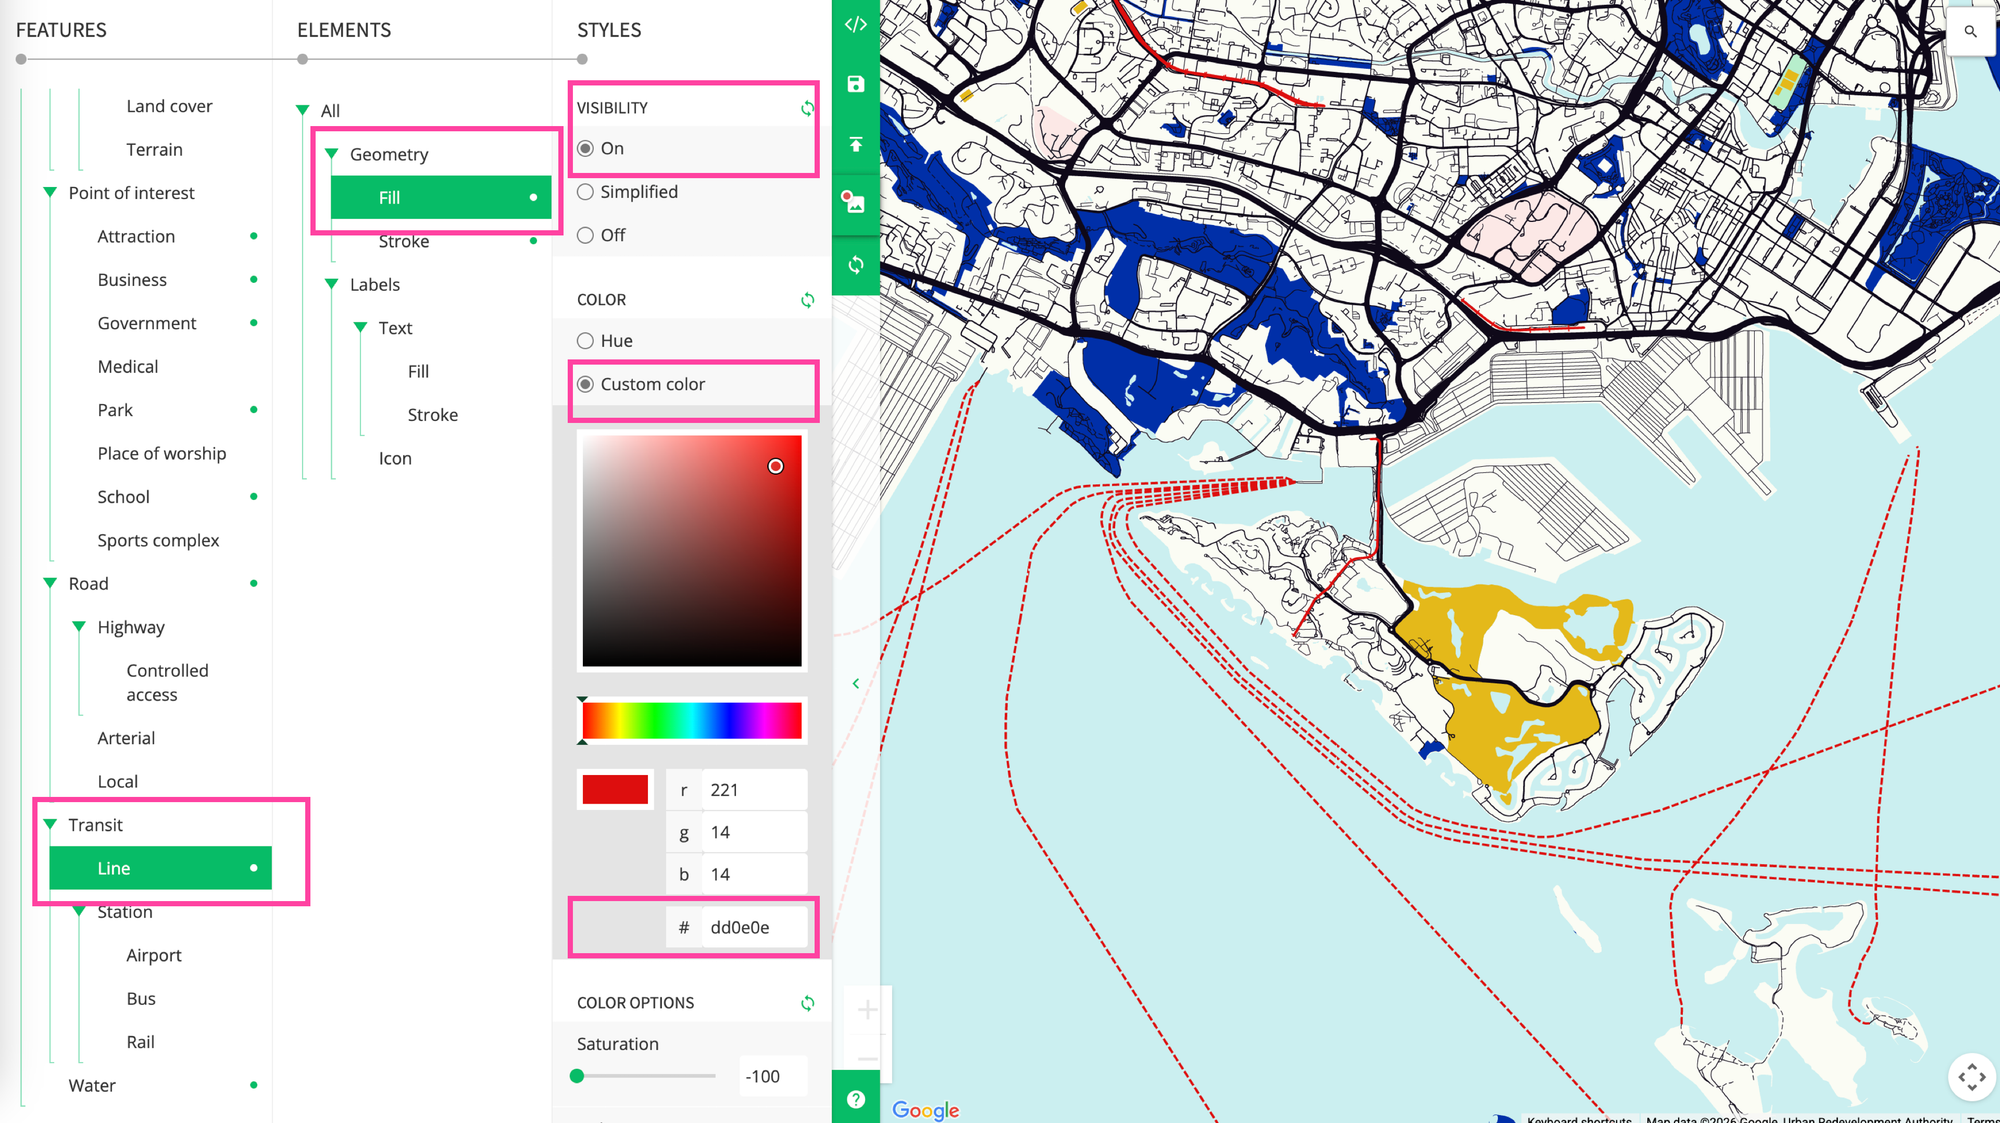
Select Transit / Line > Geometry / Fill and turn VISIBILITY on. In COLOR, choose Custom Color and enter #DD0E0E into the RGB selection menu. You should now see the train and ferry lines on the map colored in a dark red.
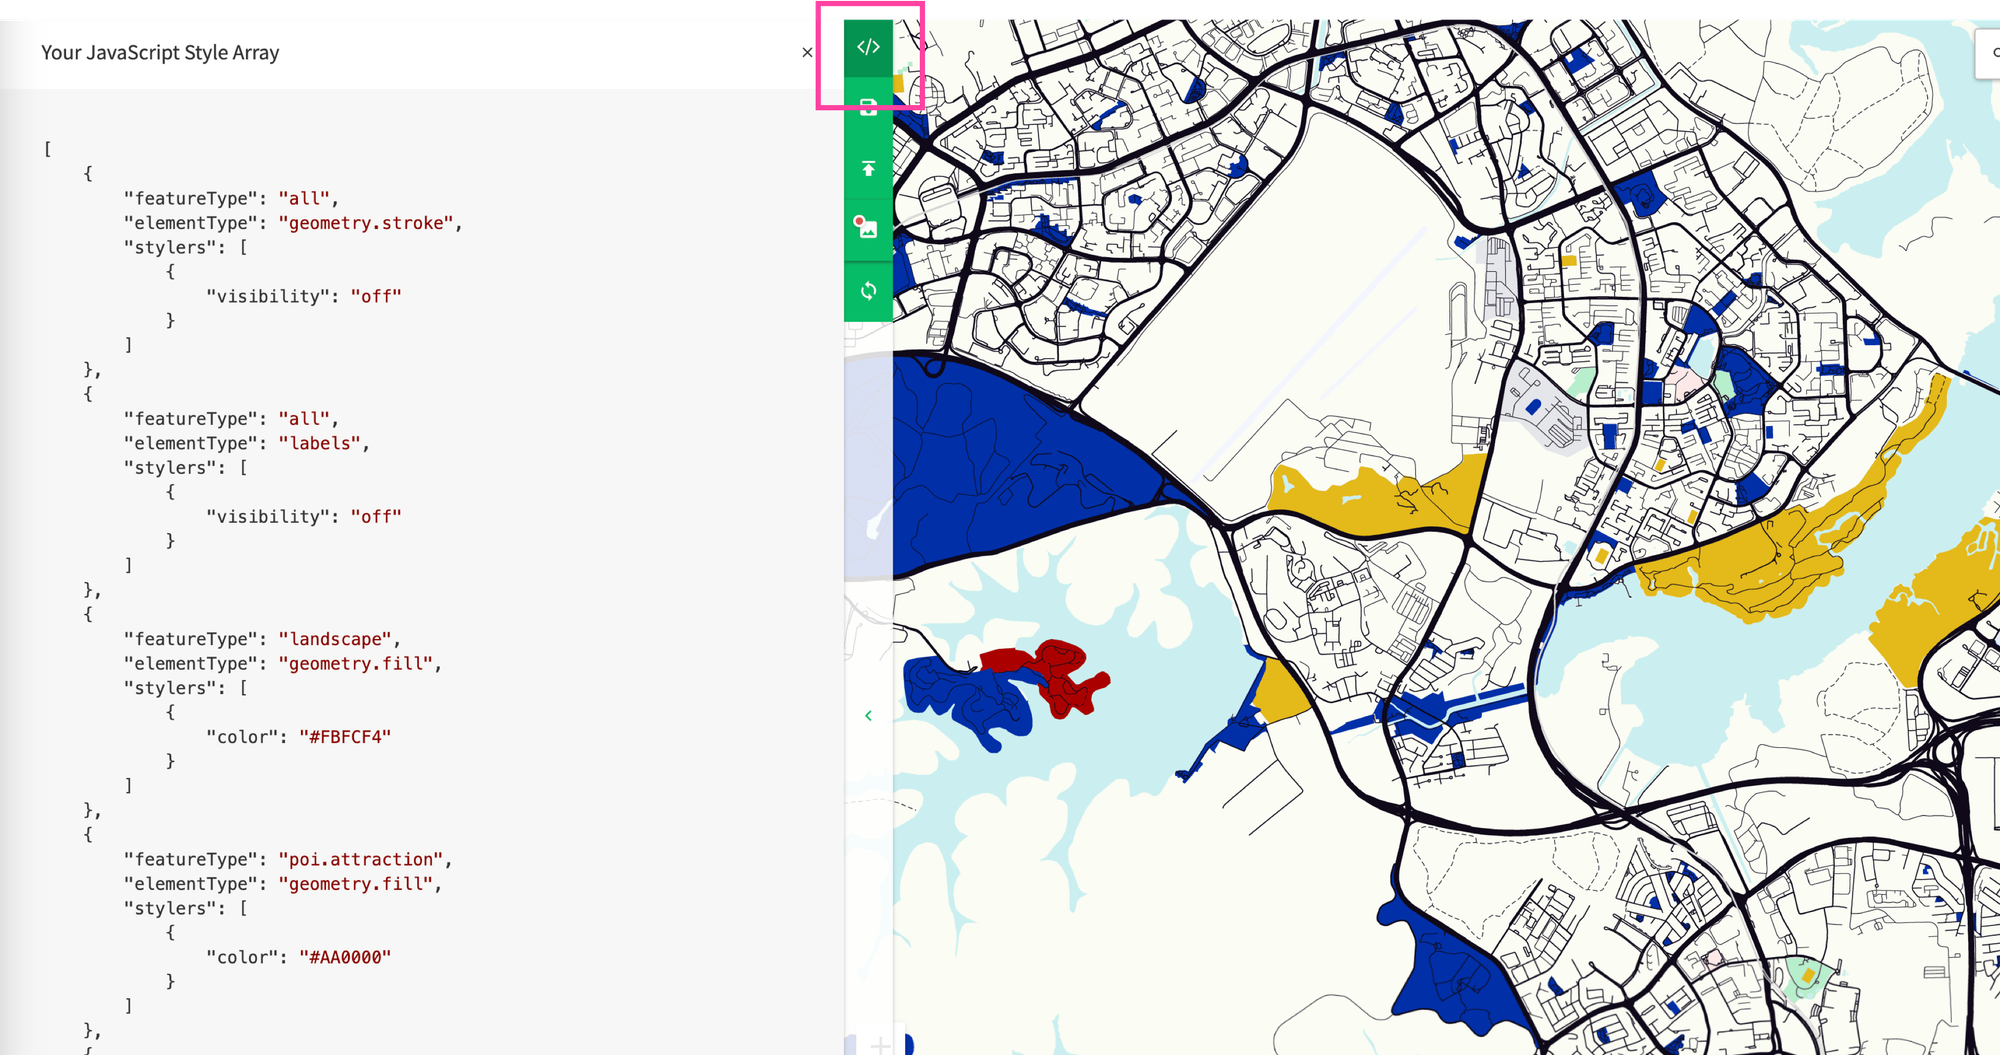
Lastly, click the [</>] code tab on right and copy the Javascript style array in the left panel to a separate file. We'll use it in the next section to apply this Mondrian inspired style to our Google Map.
Another option is the official Google Maps Styling Wizard. Select a feature type (water, roads, parks), pick an element (geometry or labels), then apply stylers like color, visibility, and weight. The map preview updates as you go. The main drawback is that the Wizard has no community element. You can't browse or piggyback off other people's work, so every style starts from scratch, which is why tools like Snazzy Maps are still very popular.
Apply styles for Google Maps: Worked example
First, scaffold a simple React app with Vite. You'll also need a Google Maps API key with the Maps JavaScript API enabled (grab a free demo key here).
Scaffold a React app with Vite
- Open Terminal and create a new project folder called
google_maps_data_styling, then switch into it. - Type
npm create [email protected] . – --template reactto create a new Vite React project in the current folder. - Run
npm installfollowed bynpm run dev.npm installdownloads all the dependencies into anode_modulesfolder.npm run devstarts the local dev server. - Point your browser to http://localhost:5173/. You should see the default Vite + React welcome page.

Add a Google Map to our React app
Next, we'll add a Google Map to the app. I've covered this in detail in a previous tutorial, Google Maps with React: Add a Google Map and style it, so I'll keep it brief here.
- In the root of your project directory, create a new file and name it
.env. Add the following lines of code to it:
VITE_GOOGLE_MAPS_API_KEY=YOUR_API_KEY
VITE_GOOGLE_MAPS_MAP_ID=YOUR_MAP_ID- In your project root run
npm install @vis.gl/react-google-maps. This downloads the @vis.gl/react-google-maps package and adds it to your project. - Replace
App.jsxwith the snippet below and runnpm run devto display a full-screen Google Map.
/*** App.jsx ***/
import { APIProvider } from "@vis.gl/react-google-maps";
import { Map } from "@vis.gl/react-google-maps";
import { useCallback } from "react";
function App() {
return (
<APIProvider apiKey={import.meta.env.VITE_GOOGLE_MAPS_API_KEY}>
<Map
style={{ width: "100vw", height: "100vh" }}
defaultCenter={{ lat: 1.29027, lng: 103.851959 }}
defaultZoom={12}
mapTypeControl={true}
// styles={mapStyle}
></Map>
</APIProvider>
);
}
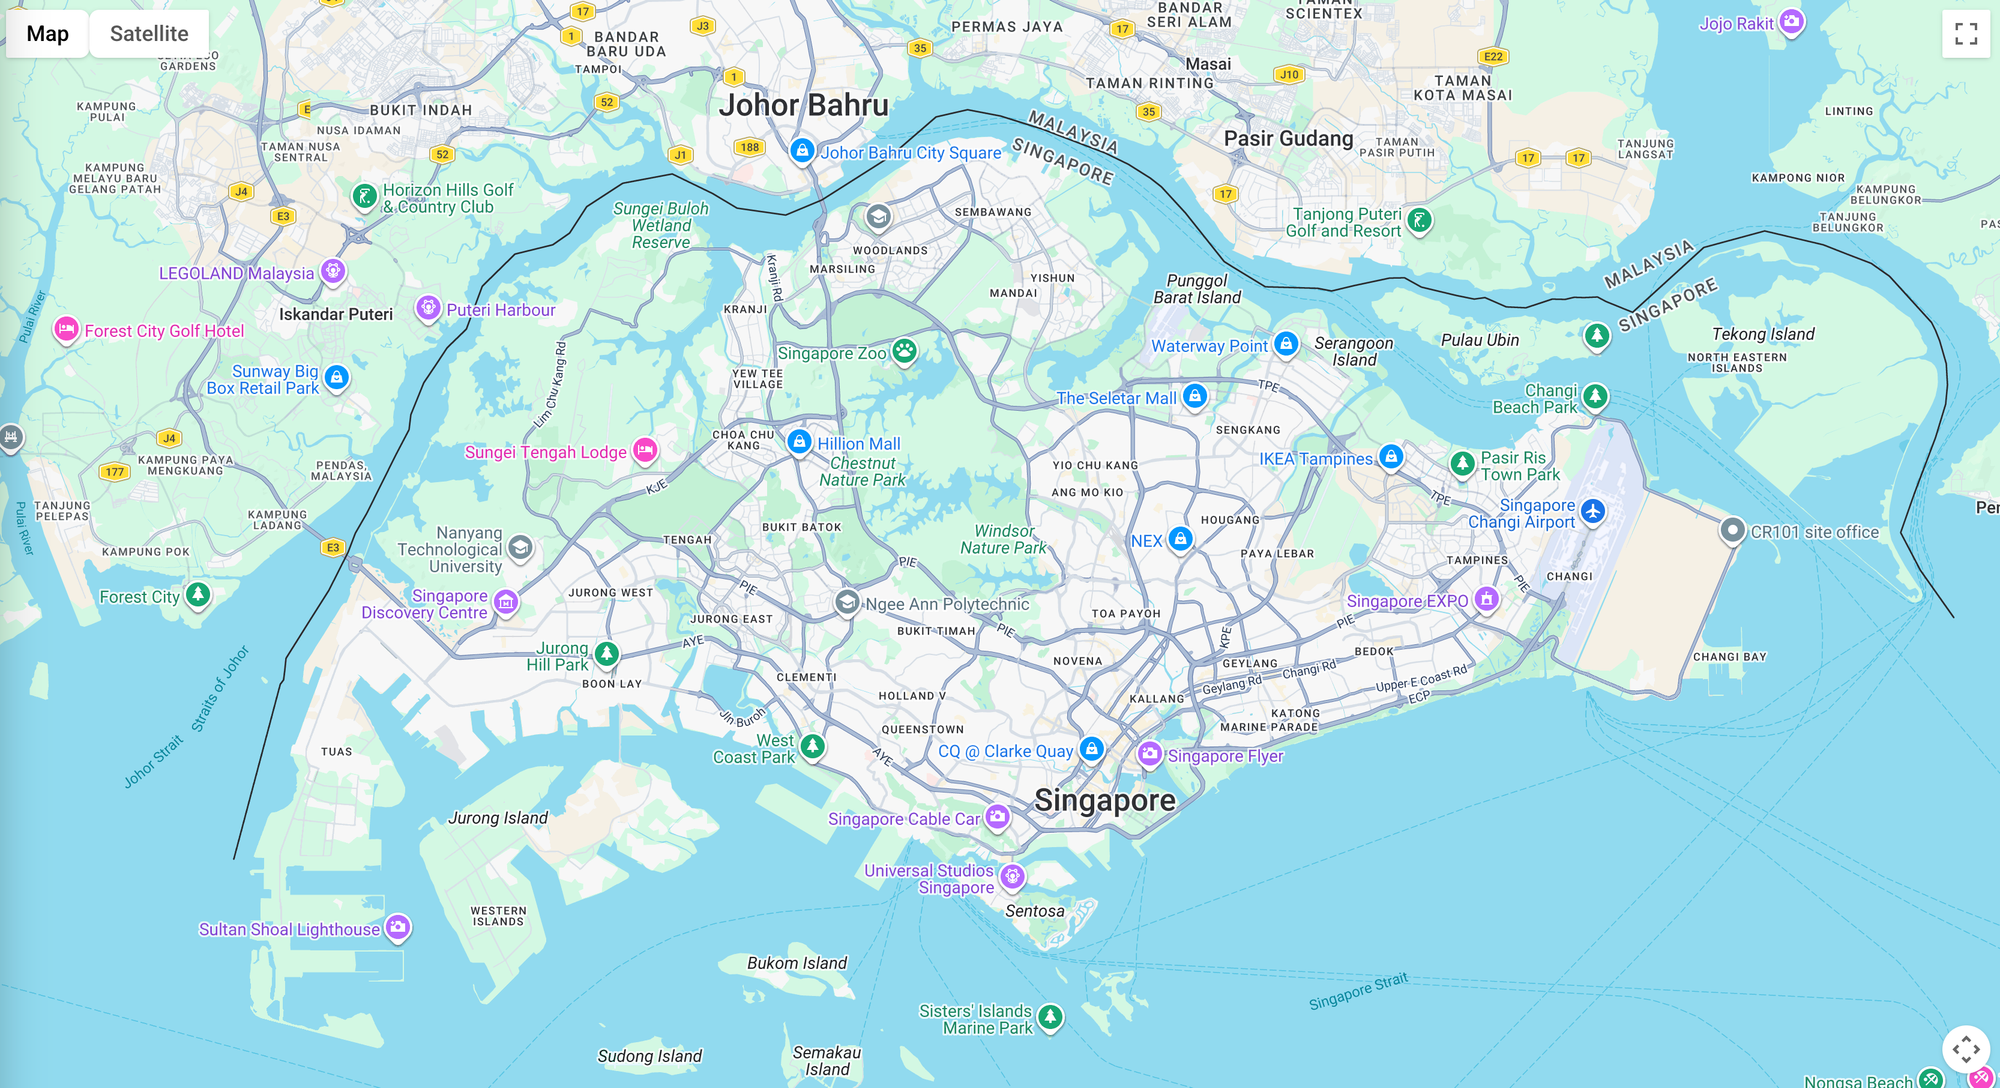
export default App;To see it, open http://localhost:5173/ in your browser. If you followed my instructions correctly you should see the default Google Maps centered on Singapore.
Add the styles array to a separate file
To keep App.jsx as slim as possible, we are going to add our styles array as a separate file.
- Create a new
/stylesfolder and add the file below. Theexport default mapStyle;at the end makes the array importable fromApp.jsx.
const mapStyle = [
    {
        "featureType": "all",
        "elementType": "geometry.stroke",
        "stylers": [
            {
                "visibility": "off"
            }
        ]
    },
    {
        "featureType": "all",
        "elementType": "labels",
        "stylers": [
            {
                "visibility": "off"
            }
        ]
    },
    {
        "featureType": "landscape",
        "elementType": "geometry.fill",
        "stylers": [
            {
                "color": "#FBFCF4"
            }
        ]
    },
    {
        "featureType": "poi.attraction",
        "elementType": "geometry.fill",
        "stylers": [
            {
                "color": "#AA0000"
            }
        ]
    },
    {
        "featureType": "poi.business",
        "elementType": "geometry.fill",
        "stylers": [
            {
                "color": "#e3b919"
            },
            {
                "visibility": "on"
            }
        ]
    },
    {
        "featureType": "poi.business",
        "elementType": "geometry.stroke",
        "stylers": [
            {
                "color": "#a60303"
            },
            {
                "visibility": "on"
            },
            {
                "weight": "1.50"
            }
        ]
    },
    {
        "featureType": "poi.business",
        "elementType": "labels.text.stroke",
        "stylers": [
            {
                "visibility": "off"
            }
        ]
    },
    {
        "featureType": "poi.government",
        "elementType": "geometry.fill",
        "stylers": [
            {
                "color": "#AA0000"
            },
            {
                "weight": "2.30"
            },
            {
                "visibility": "on"
            }
        ]
    },
    {
        "featureType": "poi.park",
        "elementType": "geometry.fill",
        "stylers": [
            {
                "color": "#002FA7"
            }
        ]
    },
    {
        "featureType": "poi.school",
        "elementType": "geometry.fill",
        "stylers": [
            {
                "color": "#AA0000"
            }
        ]
    },
    {
        "featureType": "road",
        "elementType": "geometry.fill",
        "stylers": [
            {
                "color": "#0F0919"
            }
        ]
    },
    {
        "featureType": "transit.line",
        "elementType": "geometry.fill",
        "stylers": [
            {
                "saturation": -100
            }
        ]
    },
    {
        "featureType": "water",
        "elementType": "geometry.fill",
        "stylers": [
            {
                "color": "#CBEFEF"
            }
        ]
    }
]

export default mapStyle;- Back in
App.jsx, importmapStyle, setmapTypeControl={false}(to hide the map type toggles), and passstyles={mapStyle}to the<Map />component.
import { APIProvider } from "@vis.gl/react-google-maps";
import { Map } from "@vis.gl/react-google-maps";
import { useCallback } from "react";

import mapStyle from "./styles/mapStyle";

function App() {
  return (
    <APIProvider apiKey={import.meta.env.VITE_GOOGLE_MAPS_API_KEY}>
      <Map
        style={{ width: "100vw", height: "100vh" }}
        defaultCenter={{ lat: 1.29027, lng: 103.851959 }}
        defaultZoom={12}
        mapTypeControl={false}
        styles={mapStyle}
      ></Map>
    </APIProvider>
  );
}
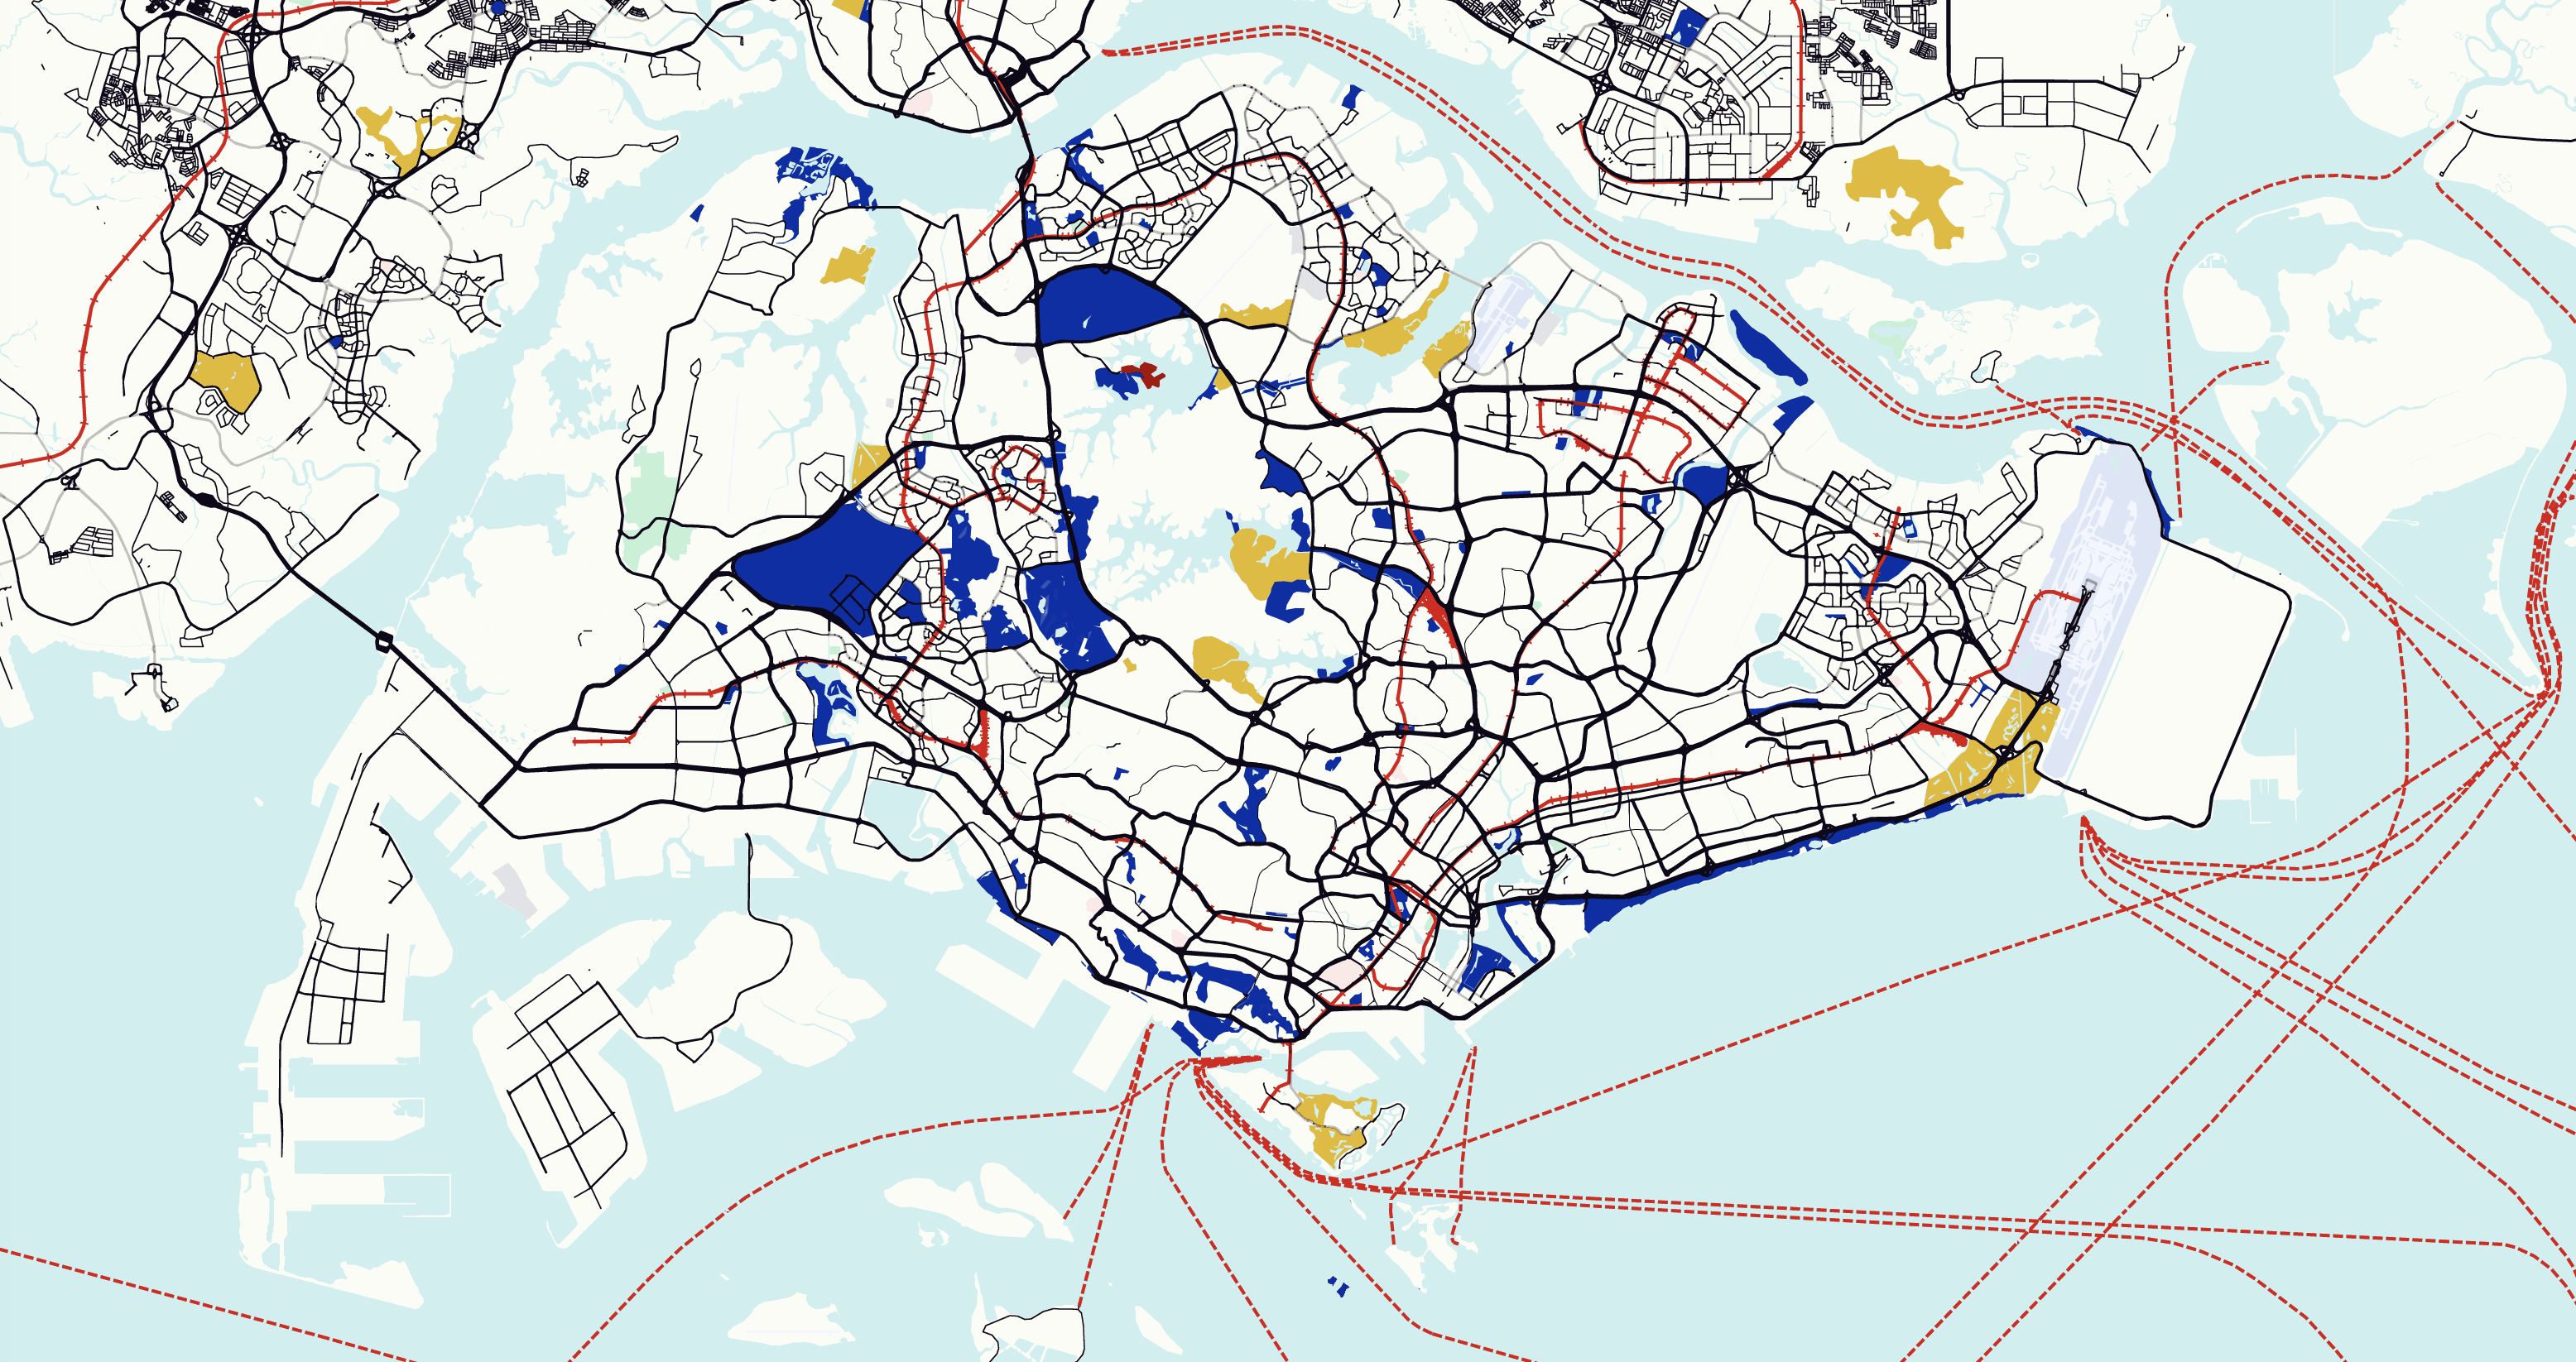
export default App;- Reload the app in your browser. You should see the same Mondrian inspired theme we created in SnazzyMaps earlier.
Full source code for the examples in this post can be found in our GitHub repository, google_maps_data_styling.
Coming up next
That's Google Maps styling with style arrays in a nutshell. It's fast, straightforward, and there are tons of free, open source styles to build from. Contrary to what you might have read online, style arrays are not going away anytime soon. It still works, Google still documents it in the active API reference, and there's no formal deprecation notice. However, Google also hasn't actively developed it for years, and all of their newer documentation steers users towards cloud based maps styling, which I'll cover in the next section.
This article was written by Afi Labs, a Google Maps Platform Premier Partner and reseller. We build route optimization, navigation, and fleet tracking software on Google Maps, and offer volume pricing on GMP licensing. Talk to an engineer or follow Afian on LinkedIn.